
Jul 06, 2014
Non-linear fit confidence intervals
Finding confidence intervals (CI) for fitting parameters is relatively easy when performing linear fits and there's a lot of material covering that. However, things are a bit more tricky when fitting data with a non-linear function. Here, I will look at how to estimate fit parameter CI in such a case and compare two approaches.
Task
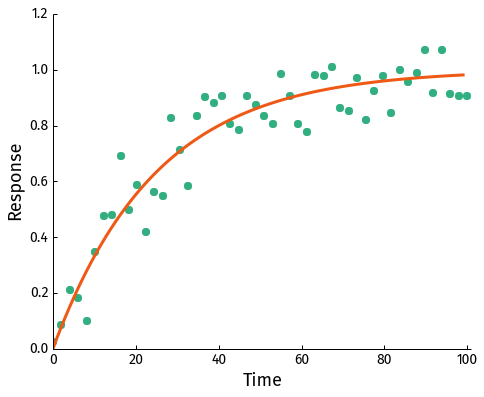
We have some data which we want to fit a model to. The data looks like this:
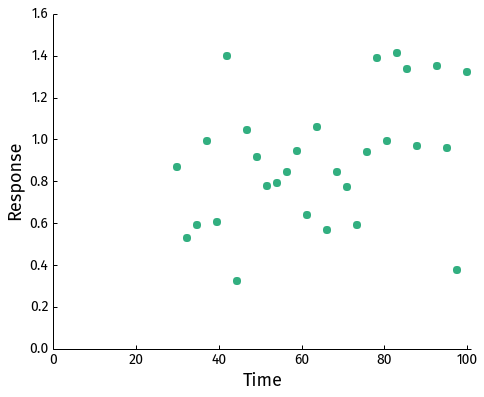
You wouldn't say it from looking at the data, but let's assume we have some prior knowledge regarding the process generating the data and it can be described by a simple exponential function: \[1-\exp(-t/\tau)\] (The data was generated with this function by setting τ= 25 s and I've made the task a bit more complicated by removing all datapoints earlier than 30 seconds.)
We're interested in estimating the value of τ from the data, but the value itself is meaningless unless we know its accuracy (i.e., the confidence interval).
First approach - asymptotic method
The quick and easy way to fit the data with our function is using the curve_fit function in scipy.optimize. For this particular dataset and function it will estimate τ to be 27.34 s. The optimizer also provides estimates for the variance of the fit parameter \(\sigma_{\tau}^2\).
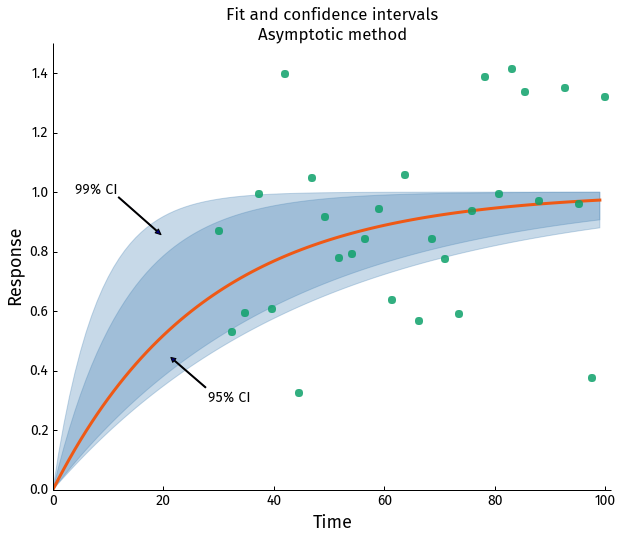
Using this we can easily calculate the CI for τ at confidence level α: $$\tau \pm t_{\alpha/2, n-1}\cdot\sqrt{\sigma_{\tau}^2}$$ where \(t_{\alpha/2, n-1}\) is the critical value of the Student's t-distribution at at α/2 and n-1 degrees of freedom. Using this we get for 95% and 99% CI: $$\mathrm{CI}_{\tau,95\%} = 27.34 \pm 2.05 \cdot 7.02 = (12.9, 41.7)$$ and $$\mathrm{CI}_{\tau,99\%} = 27.34 \pm 2.76 \cdot 7.02 = (7.99, 46.9 )$$
The CI are quite large but considering the quality of data it's not surprising. Graphically the fit and CI look like this (light shaded area is for 99% CI and dark for 95% CI)
In the case like this, where the CI are large, it might be a good idea to verify them with an alternative method.
Second approach - F-ratio
As an alternative method for estimating the CI we use the F-test. If we have two fits for the same data, we could use the F-test to determine whether or not the fits are significantly different (at some confidence level). Alternatively, we can fix a confidence level and one of the fits, then vary the other fit parameter until their F-ratio reaches the critical value for the given confidence level (the two models have to be nested in order for this to be valid). This will allow us to obtain the CI for the fit parameter.
The general formula to calculate F-ratio for two fits is: \[F=\frac{\frac{\mathrm{RSS}_0 - \mathrm{RSS}_1}{\mathrm{RSS}_1}}{\frac{df_0-df_1}{df_1}}\]
Where RSS is the the residual sum of squares and df the degrees of freedom. If y are the original datapoints and f(t) the estimates obtained from the fit then: \[\mathrm{RSS} = \sum_i (y_i-f(t_i))^2\]
In this case RSS1 is the best fit with lowest residual sum of squares ( RSSbest ) obtained from the optimizer ( τ=27.34 s ) and RSS0 is the target sum of squares for τ value we are looking for ( RSStarget ). The degrees of freedom are: \(df_1 = n-p\) and \(df_0 = n\), where n is the number of datapoints and p the number of parameters (1 in this case). Plugging all this into the F-ratio formula: \[F = \frac{\frac{\mathrm{RSS}_0 - \mathrm{RSS}_1}{\mathrm{RSS}_1}}{\frac{df_0-df_1}{df_1}} = \frac{\mathrm{RSS}_{target}/\mathrm{RSS}_{best}-1}{p/(n-p)} \] When looking for CI for a given confidence level we effectively fix the critical F value to the α level and degrees of freedom (the F distribution has two degrees of freedom). We are looking to find a τ value for which RSS reaches: \[\mathrm{RSS}{target,\alpha} = \mathrm{RSS}\{best}\cdot\left(F_{\alpha, p, n-p}\cdot\frac{p}{n-p}+1\right)\]
For the data in the example above RSSbest = 3.39, p=1, n-p = 29 : \[\mathrm{RSS}{target,\alpha} = \mathrm{RSS}\{best}\cdot\left(F_{\alpha, p, n-p}\cdot\frac{p}{n-p}+1\right)\]
At confidence level 95%, F.95,1,29=4.18 and: \[\mathrm{RSS}_{target,95\%} = 3.39 \cdot \left(4.18 \cdot\frac{1}{29}+1\right)=3.88\] and at confidence level 99% with F.99,1,29=7.60: \[\mathrm{RSS}_{target,99\%} = 3.39 \cdot \left(7.60 \cdot\frac{1}{29}+1\right)=4.28\]
Knowing these two levels, we now have to determine at what τ values these levels are achieved. We can calculate and plot the RSS for a range of τ values and find where the target RSS levels intersect with the curve:
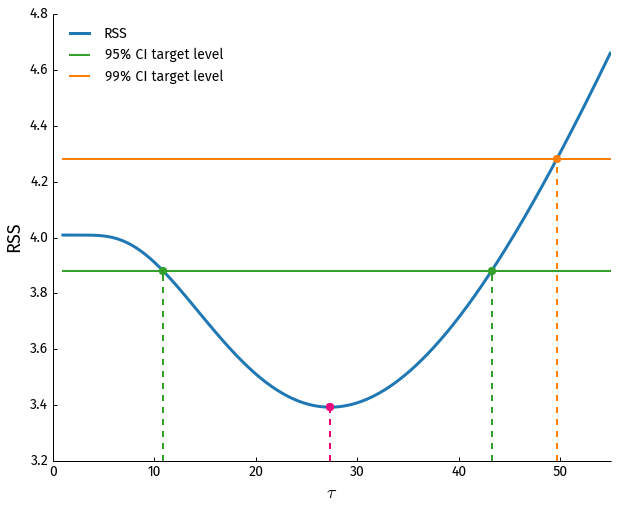
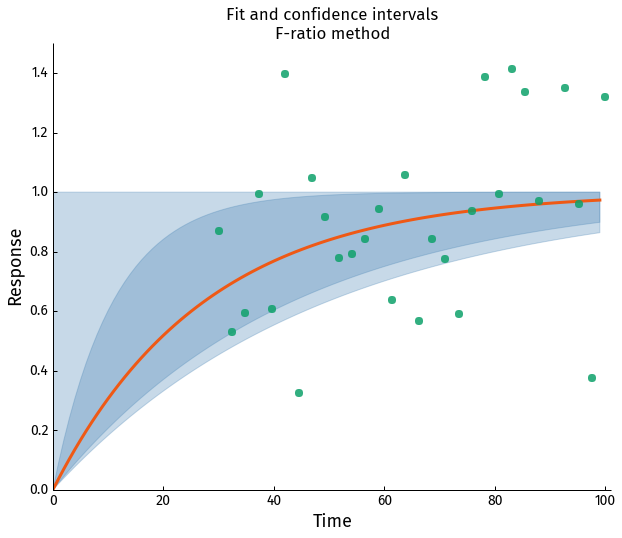
From the intersection points (green dots for 95% and orange for 99%) we get the CI for τ:
$$\mathrm{CI}_{\tau,95\%} = (10.86, 43.26)$$ and $$\mathrm{CI}_{\tau,99\%} = (0, 49.67 )$$
Not only are the CI larger than obtained from with the asymptotic method, but for 99% confidence level the target RSS level only intersects with the RSS curve at one point and the lower bound does not exist. Because negative τ values don't make sense we fix it to be 0, but essentially our data is inconclusive with regards to the lower CI bound at 99% confidence level!
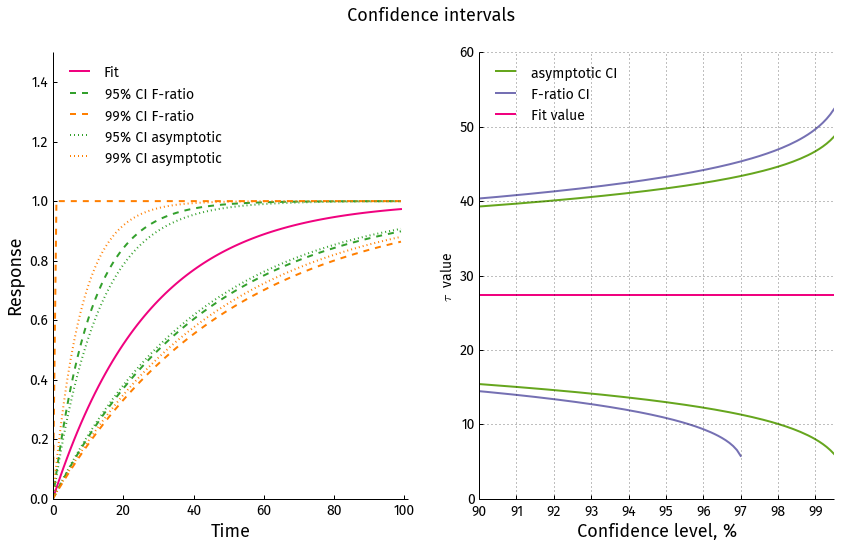
Comparison
Comparing the CI obtained with the two approaches it's clear that the asymptotic method provides an over-confident CI. In the case of 99% CI it yields a lower bound which does not actually exist.
Summary
The good news is that the approximate method is still valid in many cases when the data is not quite as ambiguous as in the example above. Below the noise level is considerably lower and no points are removed from the beginning:
 In this case both methods yield comparable results:
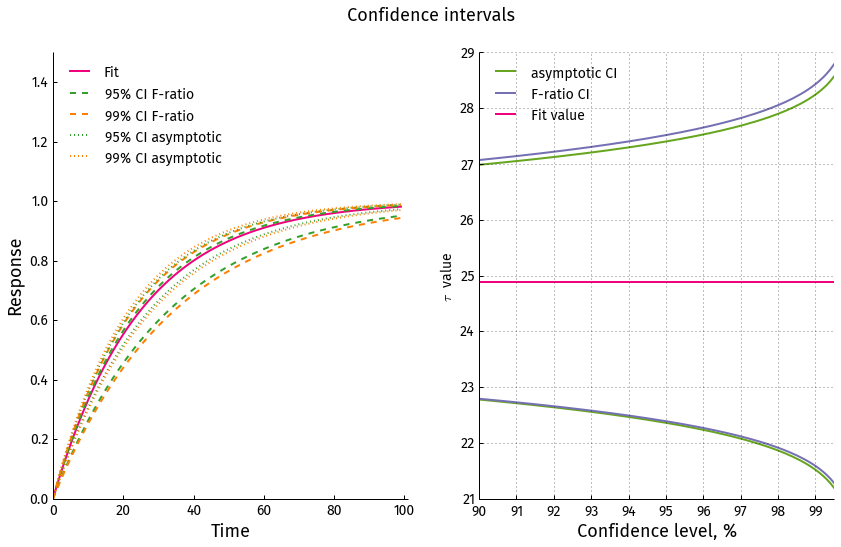 Note that the vertical scale on the right panel is almost 8 times smaller than in the more noisy case above.
Take home message is: if you get a large CI from the optimizer you might want to try an alternative approach to double check it.
In the future I will discuss how to use the F-ratio method for finding CIs for multiple parameter non-linear fits.